Dashboard Overview
Once you've registered and logged in, you'll be greeted by your personalized PingWeb dashboard. This is your control center for all monitoring activities.
Take a Tour
To help you get started, we offer an interactive tour of the dashboard. Once you log in, a popup will appear offering to guide you through the main features and functionalities. This tour is designed to give you a comprehensive overview and useful tips for using PingWeb.

Work Zone
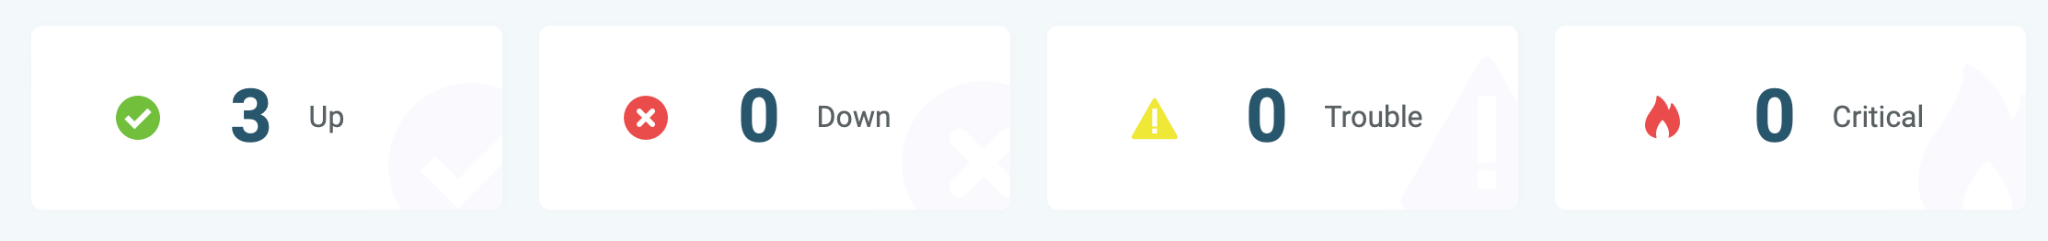
Top Indicators: At the top of the dashboard, you’ll find four indicators:
- Up: Number of websites currently operational.
- Down: Number of websites currently unavailable.
- Trouble: Number of websites experiencing issues.
- Critical: Number of domains that have expired or are nearing expiration.
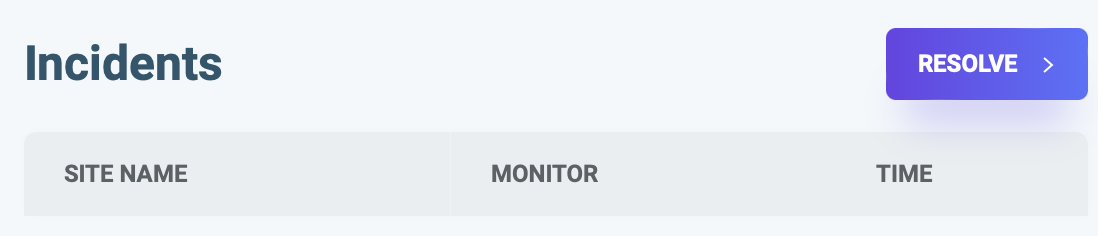
Incident Table (Left Side): Displays all incidents affecting your websites. Click "Details" for comprehensive incident information.
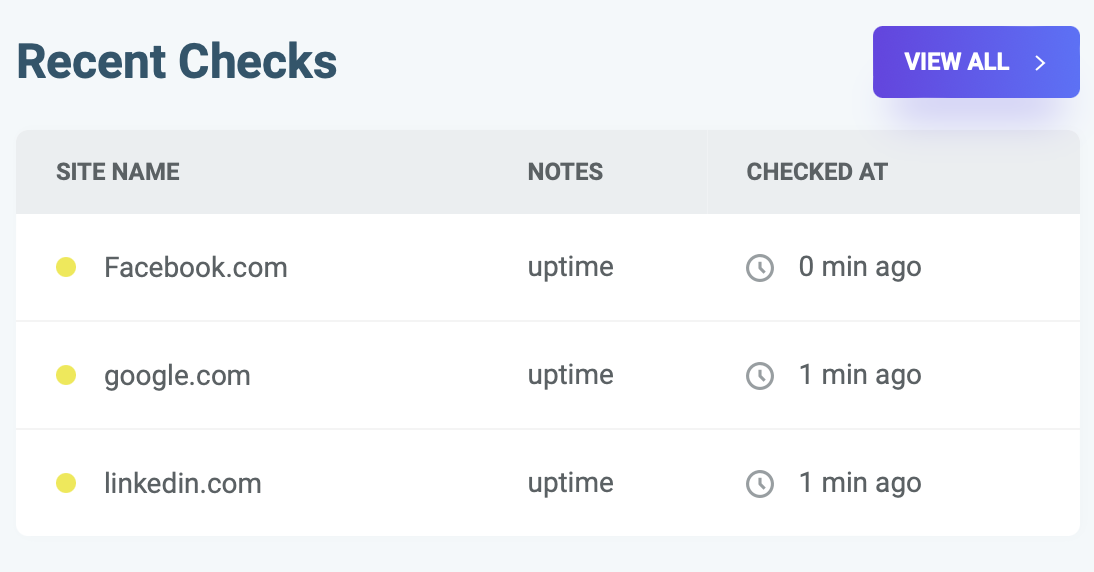
Recent Checks Table (Right Side): Shows the most recent checks on your websites, providing quick status updates.
Website List: View key metrics for each website, such as 24-hour availability, response code, and response time. Add new websites by clicking "Add new" and selecting the desired monitor type. Click on a specific website for more detailed information.
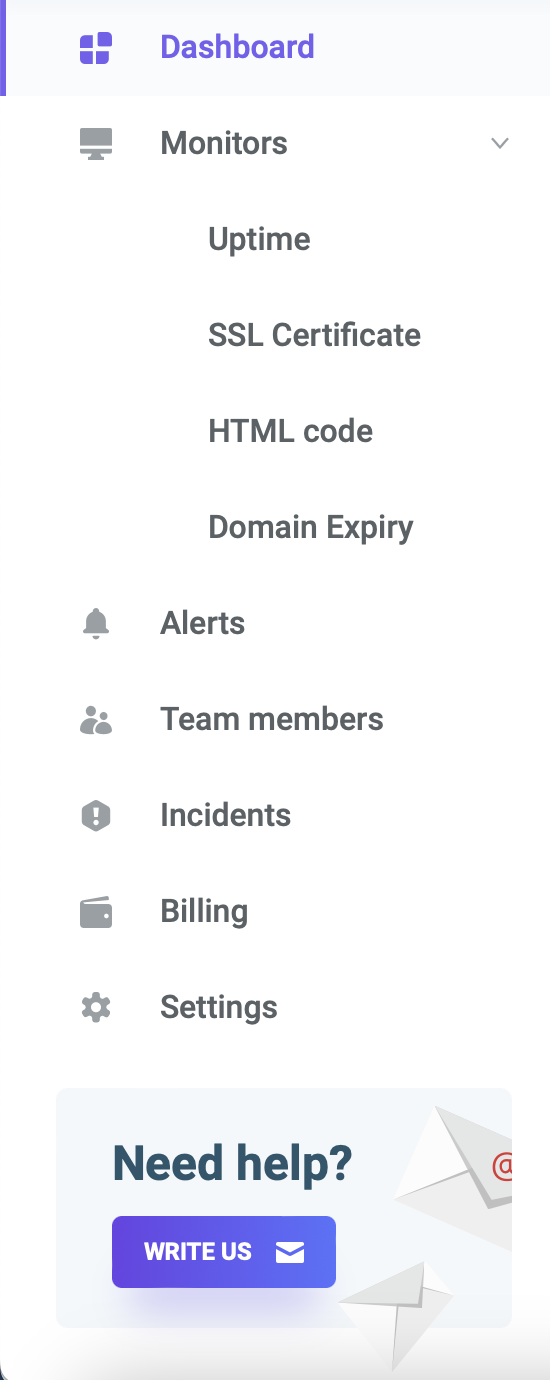
Menu (Left Side)
The left-side menu provides access to different sections:
-
Monitors:
- Uptime: Set up and manage uptime monitoring.
- SSL Certificate: Manage SSL certificate monitoring.
- Source Code: Monitor source code changes.
- Domain: Keep track of domain expiry dates.
-
Alerts:
- Configure alerts and customize notification preferences.
-
Team Members:
- Add team members and select their notification methods.
-
Incidents:
- View a detailed list of recent incidents.
-
Billing:
- Manage subscription plans and billing information.
-
Settings:
- Update profile settings and change your password.
-
Write Us:
- Contact PingWeb support for assistance.